
Last week marked a major milestone for the Cycleops team, as we deployed our new solution for a multi-tenant Monitoring as a Service solution for Cycleops. This solution required pivoting our approach for monitoring and the way we present it to our users.
What should monitoring look like and why should I care?
One of the most difficult problems in modern systems design is how to monitor each part of the infrastructure efficiently. There are a lot of different articles and approaches on how this can be achieved, though there are several points that are common to all approaches.
Monitoring should be easy to add
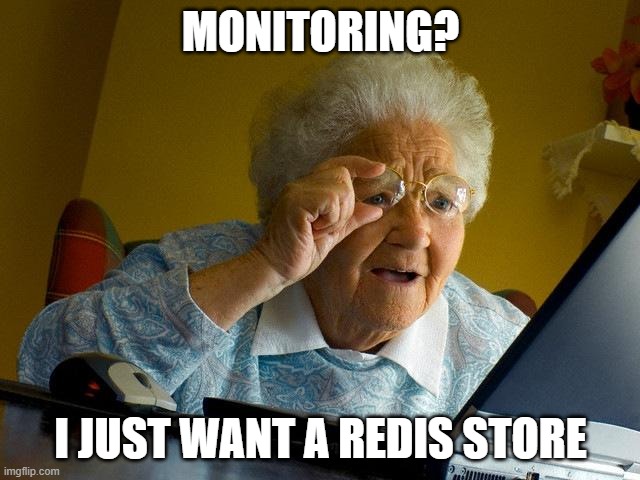
Imagine that a Dev team in your organization needs to add a new Redis store for a new feature; and your current monitoring solution does not easily support this addition, as is. If adding a new piece of infrastructure is a pain for your team or the organization does not enforce monitoring, chances are Redis will be left unmonitored; until, eventually, an instance of downtime or troubleshooting of a bug points to Redis. At which point, monitoring would be added, but at the cost of monitoring too late. What if there was another way; and as soon as you add Redis to your infrastructure monitoring was provided without any extra action?
Monitoring is important, Visualizations are essential
Monitoring as much as possible is important to gather data; but it is almost impossible to gain any valuable insight only from data points. Even if you export millions of entries to a spreadsheet and plot them 🙂. Is an average 55% of CPU usage after a release or upgrade worth investigating? For most of us, this level of CPU usage would be perfectly reasonable; right? What if you had a look into CPU usage visualization for all previous releases and upgrades in the past 2 years and the CPU usage was consistent at 20% and the increase is not documented or justified anywhere? This would certainly start some discussions in engineering teams, to make sure there aren’t any unintended side effects.
Do not alert rarely; Do not alert often
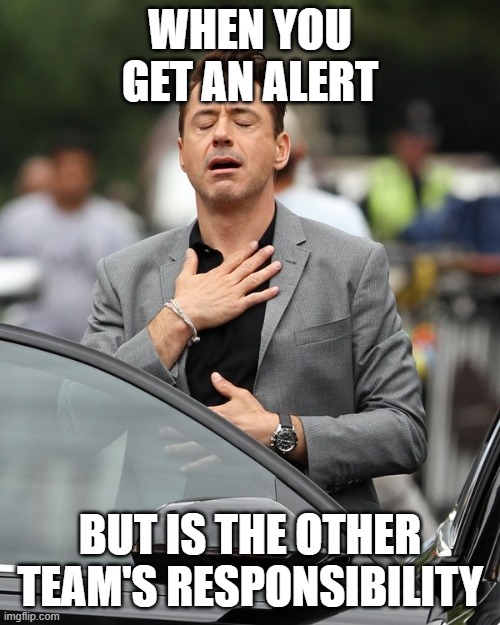
Alerting can prove to be a major factor in preventing downtimes, if done correctly. Alert too rarely and you get a notification 30 minutes into the downtime, alert too often, without filtering, and you train a team to ignore alerts. The next thing you know is, you get a phone call that something is wrong, 30 minutes into the downtime 🙂. Alert routing is also crucial, as alerting the wrong team for the wrong part of the infrastructure or alerting multiple teams that have nothing to do with the problematic part of the system can lead to frustration; and, usually, loss of valuable time.
Monitoring more is better
This is pretty self-explanatory; the more parts of your infrastructure and application you monitor, the better insights you can get into your system.
What is our take on the “Monitoring as a Service” problem?
As the Cycleops team, our vision is to enable every modern software vendor with a complete suite of automation tools; useful for application deployment and operations on the cloud, so they can focus on their business growth.
In other words, we want to automate all DevOps aspects of an organization, in order to focus on what’s important to them.
With this in mind, we want to provide Monitoring as a Service, out of the box, when a user deploys their application Stack.
Did you add a new Redis store in your Stack? We have you covered; as soon as you deploy the Stack, it’s monitored without requiring any more interaction.
Is there a suspicious metric, like excessive CPU usage? No worries, we visualize all monitoring metrics on Grafana dashboards, for real-time insights and historical reference.
Is there something wrong with your application? Relax; with the use of Contacts, you can set the appropriate channels, per Environment, for alerting the correct people and taking prompt action.
Our goal is, as soon as a user adds and deploys a new piece of infrastructure in their Stack, it is instantly monitored without any additional burden.
So, what did we do wrong in our previous design? And what does our new approach look like?
In our first approach, Monitoring as a Service was given out of the box, as well; with a few major differences.
First, and more important, was the fact that the piece of infrastructure that was providing the monitoring service was set up on our own servers. Unfortunately, this could introduce network latency issues, as metrics from a user’s Host would transmit securely to our monitor server.
Also, this design would prevent our users from monitoring Hosts in private networks with no access to the public.
Lastly, this solution didn’t scale; both in terms of cost management and operational effort.
- Ok so do you use blockchain now?
- Well, not yet. But soon. :/
With our new design, users can add and register Hosts that will run their own dedicated monitoring service. We have “Inception-ized” our approach; Cycleops uses the Cycleops platform, to automatically create the appropriate Environments, Services, Stacks and Setups, to set up Monitoring as a Service. Utilizing our jump-host solution, these Hosts can be in private networks, accessed by bastion machines; the monitoring data never leave a user’s private network. A user can just as easily design their own infrastructure and, upon deployment, all the different parts will be monitored, in a secure and automated way. Just like we believe Monitoring as a Service should be.
Give Cycleops a try, here.